Category: news
-
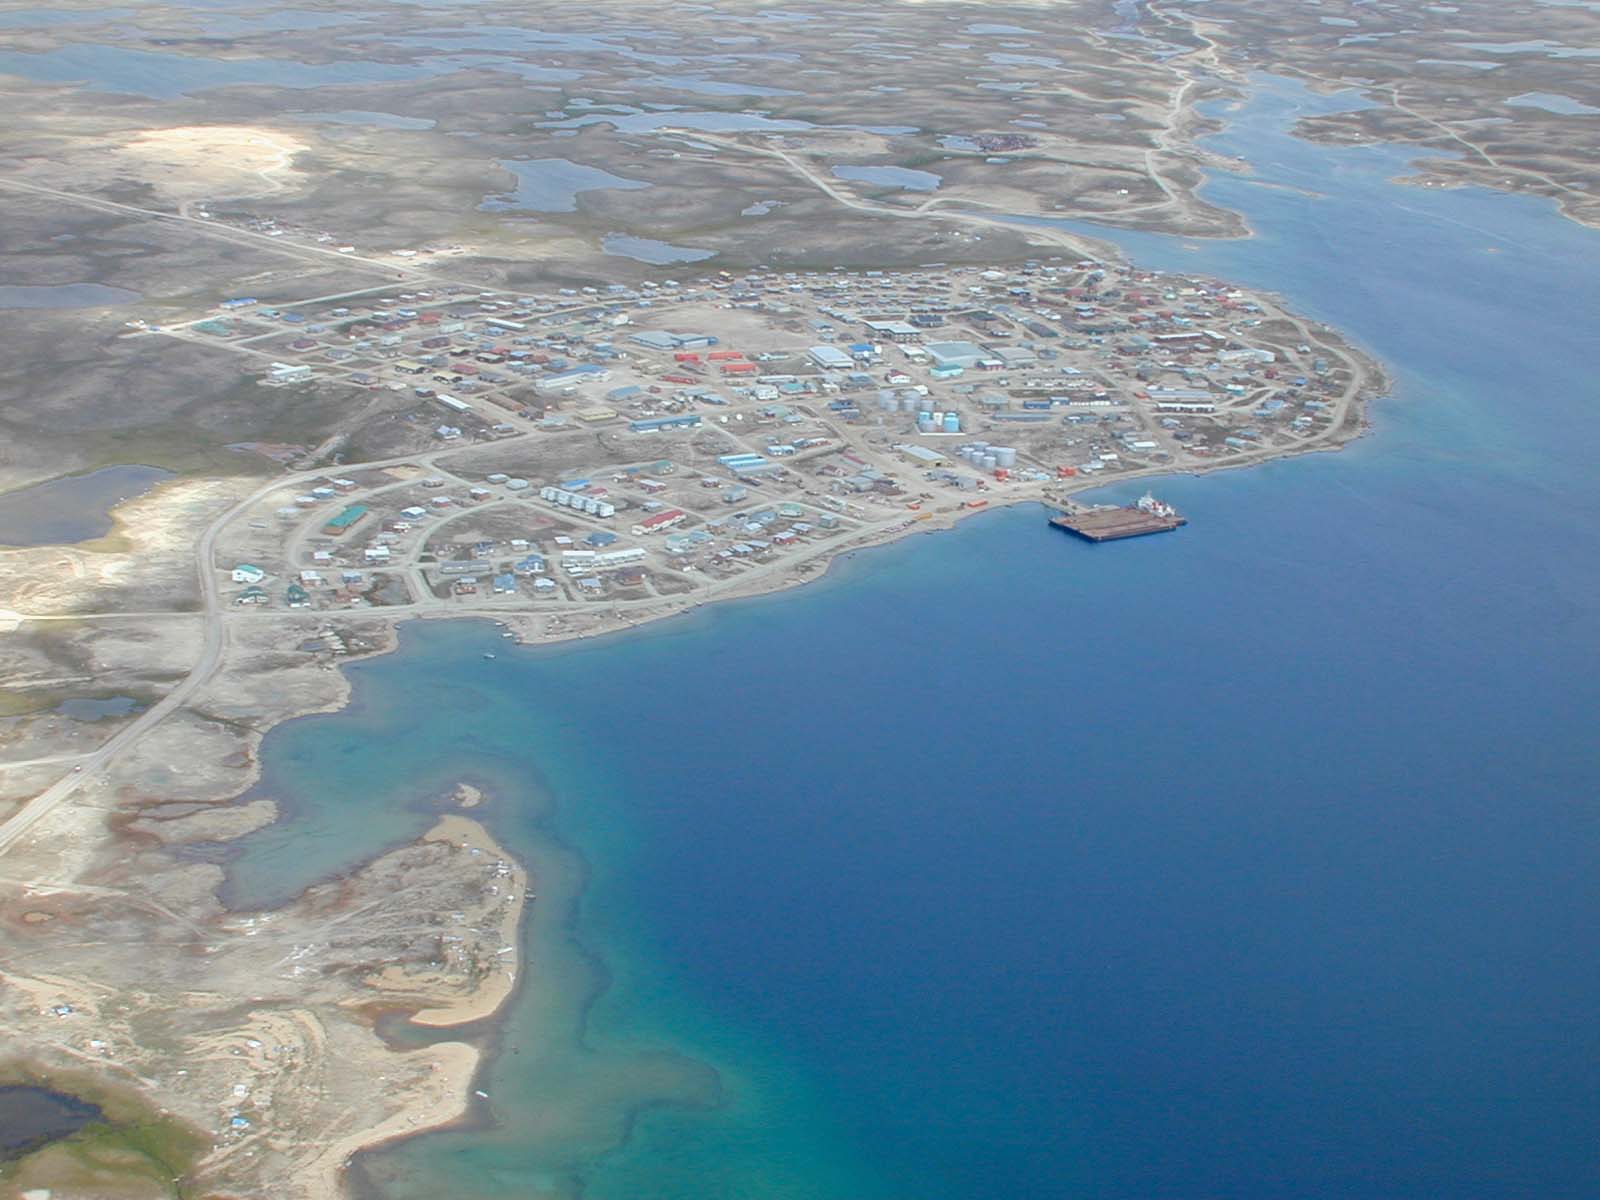
Canada picks site for Arctic Research Station
Cambridge Bay location offers a wealth of opportunities for studying the far north. After months of deliberation, the Canadian government has chosen Cambridge Bay — a hamlet midway along the Northwest Passage in the country’s far north — as the site for a world-class Arctic research station. Once built, the station will house scientists all…
-
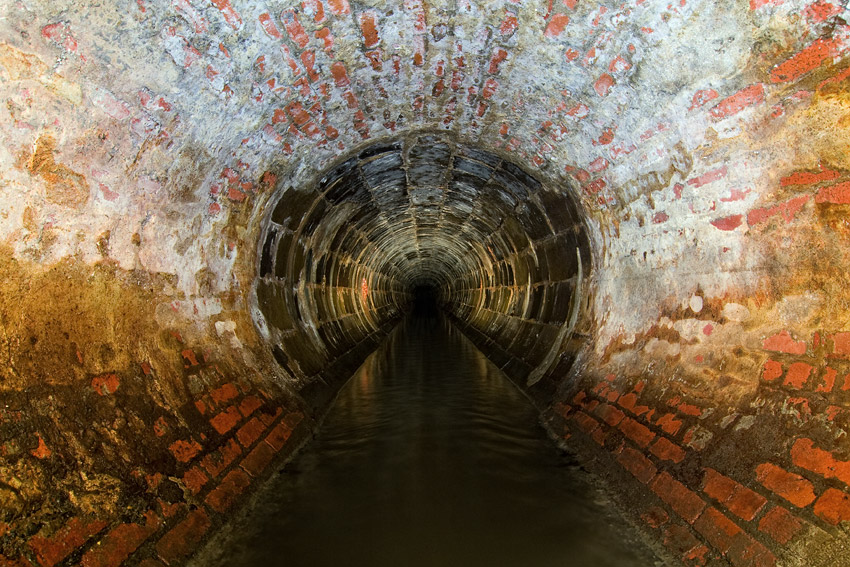
Sewer studies based on leaky science
Questionable sampling techniques have led to murky conclusions about the contents of waste water. Chemicals flushing into sewer systems have been in the news for years. From opiates and hormones to heart medications, studies have detected a range of pollutants. Tests of sewage from hospitals have uncovered antibiotics, and investigations of sewage systems have exposed…
-
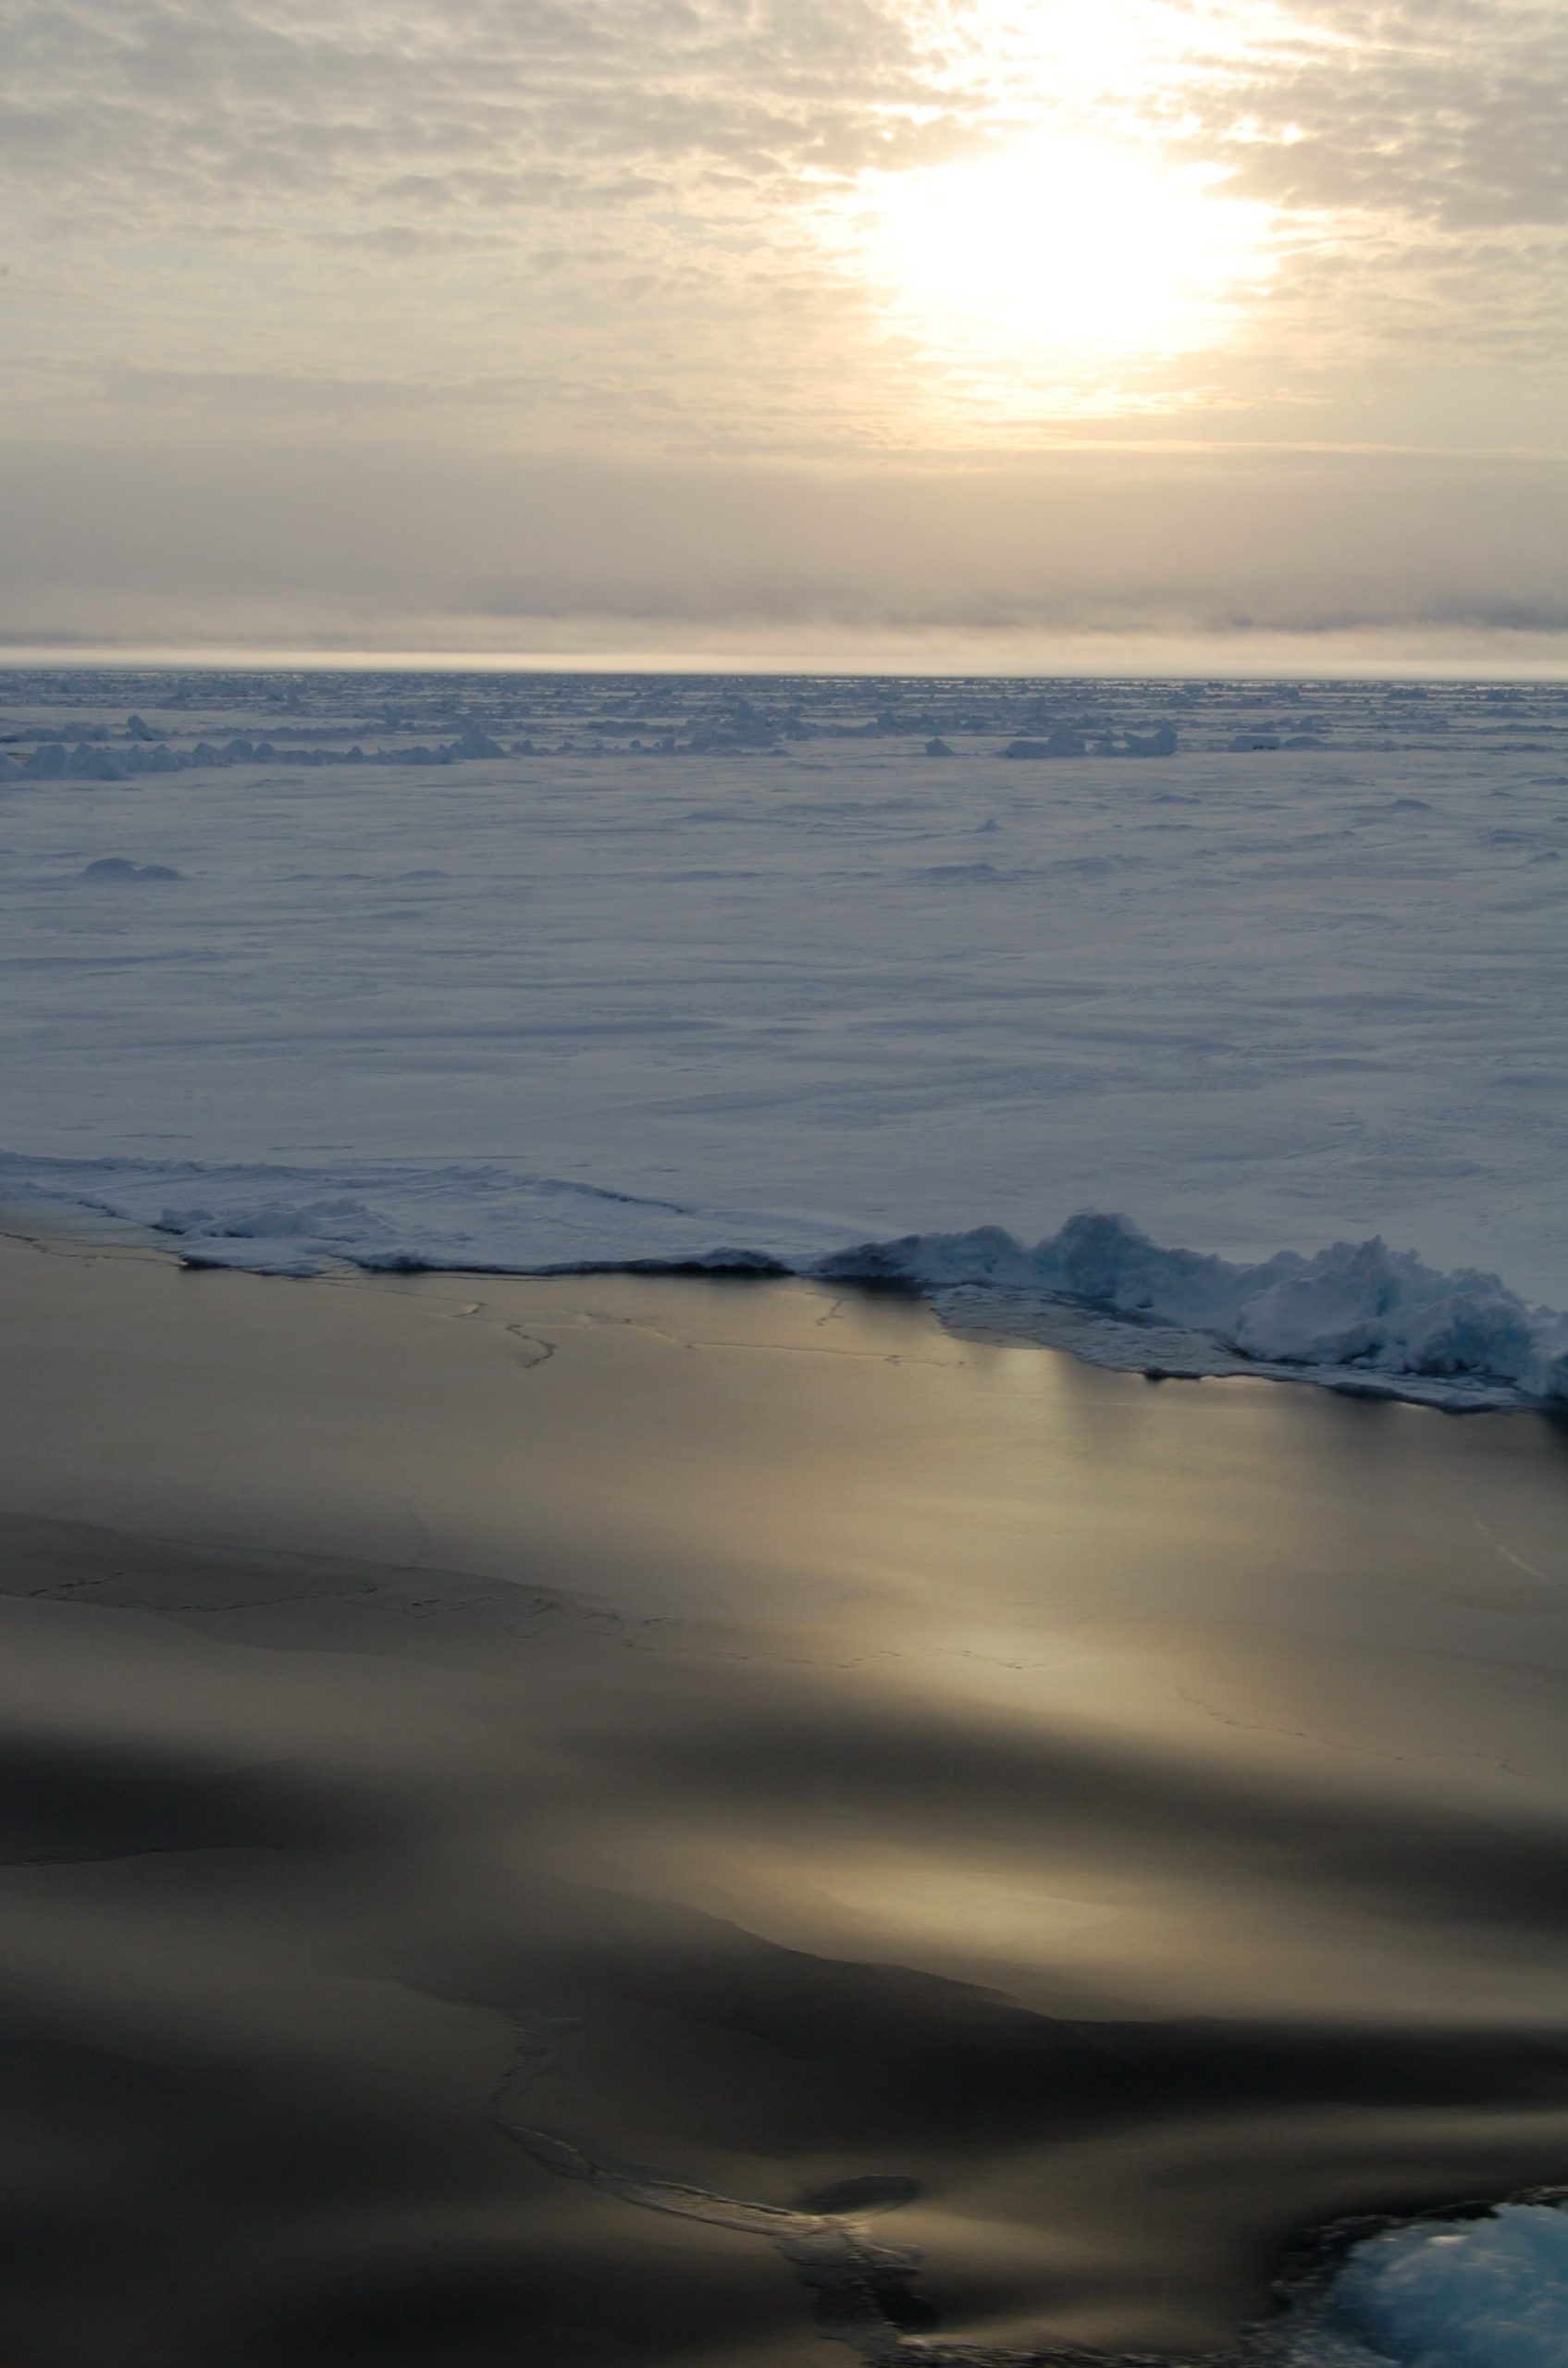
Arctic Ocean full up with carbon dioxide
Loss of sea ice is unlikely to enable Arctic waters to mop up more carbon dioxide from the air. As climate scientists watched the Arctic’s sea-ice cover shrink year after year, they thought there might be a silver lining: an ice-free Arctic Ocean could soak up large amounts of CO2 from the atmosphere, slowing down…
-
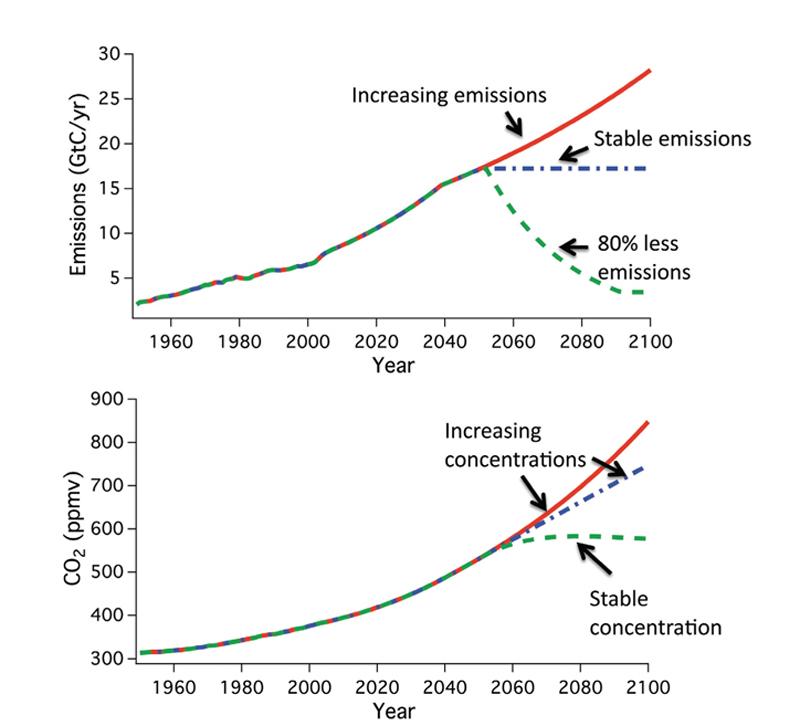
Report maps perils of warming
Degree-by-degree breakdown of climate effects published. As the US Senate gears up to debate the latest incarnation of proposed climate legislation next week, a blue-ribbon panel has released what it hopes will be a definitive guide to the consequences of climate change for lawmakers and the public. In offering a degree-by-degree breakdown of the potential…
-

CSWA Ottawa conference report: Tools for tomorrow’s science writer
At Sunday’s workshop, Tools for Tomorrow’s Today’s Science Writer, four panelists shared their thoughts about online tools, transparency, and better story telling. It was no surprise to hear that journalism is experiencing a big shift from print to online. But, as Asmaa Malik pointed out, the fundamentals remain the same. We must find the stories,…